
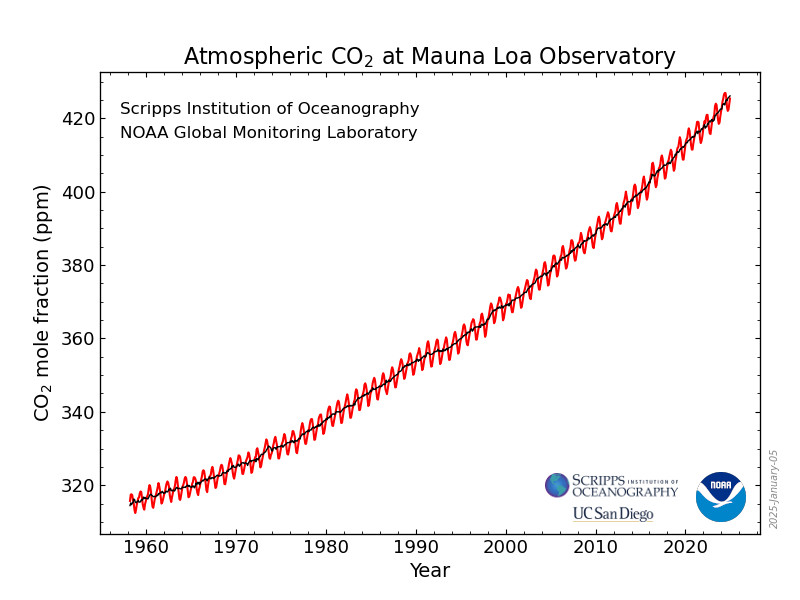
A line graph showing atmospheric CO2 levels at Mauna Loa Observatory from 1955 to 2025. The y-axis represents CO2 mole fraction in parts per million (ppm), ranging from 320 to 420 ppm, while the x-axis is years.
https://s3.eu-central-2.wasabisys.com/mastodonworld/media_attachments/files/113/951/200/102/338/624/original/878abf323baca8a3.png